Recently, I got to thinking . . . it seems like my ancestors lived to be awfully old. Lots of them lived to be in their 80s & 90s. And didn’t people used to have a shorter life expectancy? And lots of women used to die in childbirth. I think I only have found one case of that with my ancestors.
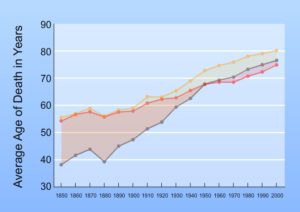
So I went searching and I love what they have done here at the Mapping History Project graphing life expectancy. I managed to grab a screenshot showing all three of these at once:

- The black line is life expectancy for both men & women from birth
- The red line is life expectancy for men at age 5
- The yellow line is life expectancy for women at age 5
It really shows how infant mortality was a huge problem – look at that big gap between the black line & the other two lines between 1850-1890.
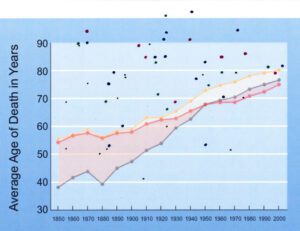
Then I put my ancestors on the chart by hand:

- Blue dots – my paternal female ancestors (It is a little hard to tell the blue from the black, but the black are the small dots & the blue are the larger dots.)
- Black dots – my paternal male ancestors
- Green dots – my maternal male ancestors
- Red dots – my maternal female ancestors
Since the original chart is average age of death, you would expect my ancestors (the dots) to be equally above & below the lines. But they are not. There are so many that lived much longer than you would have expected.
Here are my Longevity Stars (the ones that are off the top of the chart):
- Sarah Crose Van Benschoten died 22 Nov 1944 at the age of 103
- Peter Leclair Houle died 13 Oct 1922 at the age of 97
- May Williams Atchison died 15 Dec 1971 at the age of 95
- Abigail (Abbott) Harrington Holman died 6 Feb 1926 at the age of 94
- Foelke Janshen Tholen Iwwerks died 7 Jun 1874 at the age of 94
- Anna Olsdtr Bjaastad died 13 Jul 1928 at the age of 91
- Dena Ubben Iwwerks Middendorp died 7 May 1939 at the age of 91
- Jane Anisworth Williams died 9 Nov 1872 at the age of 90
What a fun exploration – I hope I inherited those longevity genes!